1.9 KiB
Exercise: Growth curve model with interaction
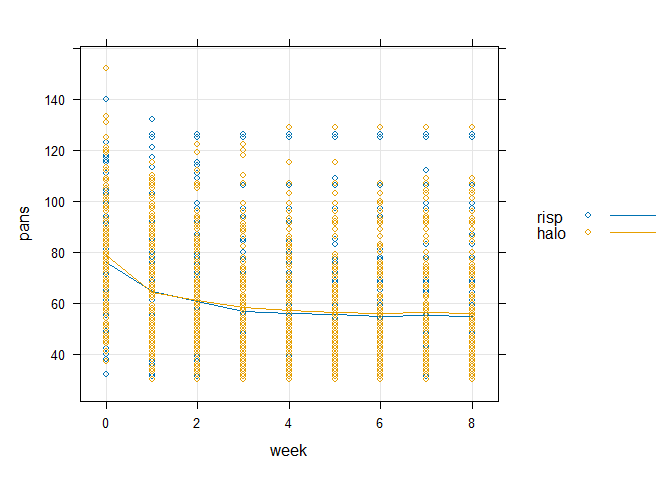
Risperidone vs. haloperidol and schizophrenia (Möller et al. 2008)
Analyze the data from moeller.csv:
pans: Positive and Negative Symptom Scale for schizophreniatreat: medication grouprisp: atypical neuroleptic risperidonehalo: conventional neuroleptic haloperidol
dat       <- read.table("../data/moeller.csv", header = TRUE, sep = ",")
dat$id    <- factor(dat$id)
dat$treat <- factor(dat$treat, levels = c("risp", "halo"))

lattice::xyplot(pans ~ week, data = dat, groups = treat,
                type = c("g", "p", "a"), auto.key = TRUE)
-
What is the sample size in each treatment group?
-
Estimate a random slope model
- What are the estimates for the fixed effects and variance components?
-
Fit a model with quadratic time trends for the population and individual subjects
-
Add an interaction with treatment for the linear and the quadratic effects for week and test them
-
Interpret your results: Which model would you choose?
-
Refit the model that you chose with a centered week variable:
- Compare the estimates for your fixed effects and the covariance components
- Which estimates change and why?
Reference
Möller, H.-J., M. Riedel, M. Jäger, F. Wickelmaier, W. Maier, K.-U. Kühn, G. Buchkremer, et al. 2008. “Short-Term Treatment with Risperidone or Haloperidol in First-Episode Schizophrenia: 8-Week Results of a Randomized Controlled Trial Within the German Research Network on Schizophrenia.” International Journal of Neuropsychopharmacology 11 (7): 985–97. https://doi.org/10.1017/S1461145708008791.