2.0 KiB
2.0 KiB
Two-by-two ANOVA: Power simulation of the interaction test
Last modified: 2026-01-09
Application context
Effect of fertilizers
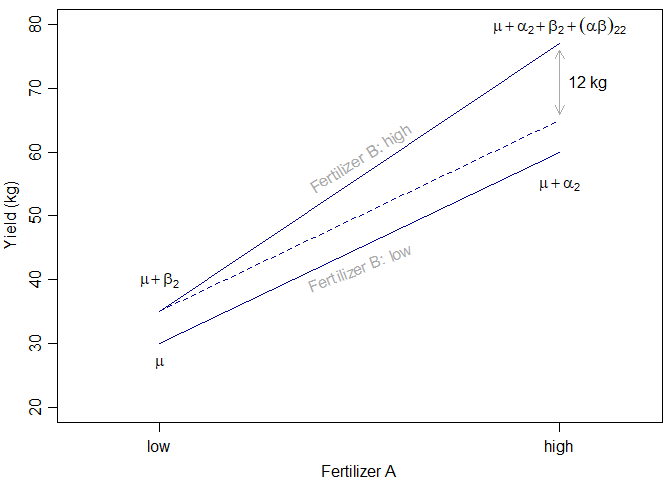
In an experiment, two fertilizers (A and B, each either low or high dose) will be combined and the yield of peas (Y) in kg be observed. Goal is to detect an increase of the Fertilizer-A effect by an additional 12 kg when combined with a high dose of Fertilizer B (interaction effect).
Model
Assumptions
Y_{ijk} = \mu + \alpha_i + \beta_j + (\alpha\beta)_{ij} + \varepsilon_{ijk}\varepsilon_{ijk} \sim N(0, \sigma^2) \text{ i.i.d.}i = 1, \dots, I;j = 1, \dots, J;k = 1, \dots, K\alpha_1 = \beta_1 := 0
Hypothesis
- H$0^{AB}\colon~ (\alpha\beta){ij} = 0 \text{ for all } i,j$
Setup
set.seed(1704)
n <- 96
dat <- data.frame(
  A = factor(rep(1:2, each = n/2), labels = c("low", "high")),
  B = factor(rep(rep(1:2, each = n/4), 2), labels = c("low", "high"))
)
X <- model.matrix(~ A*B, dat)
unique(X)
##    (Intercept) Ahigh Bhigh Ahigh:Bhigh
## 1            1     0     0           0
## 25           1     0     1           0
## 49           1     1     0           0
## 73           1     1     1           1
beta <- c(mu = 30, a2 = 30, b2 = 5, ab22 = 12)
means <- X %*% beta
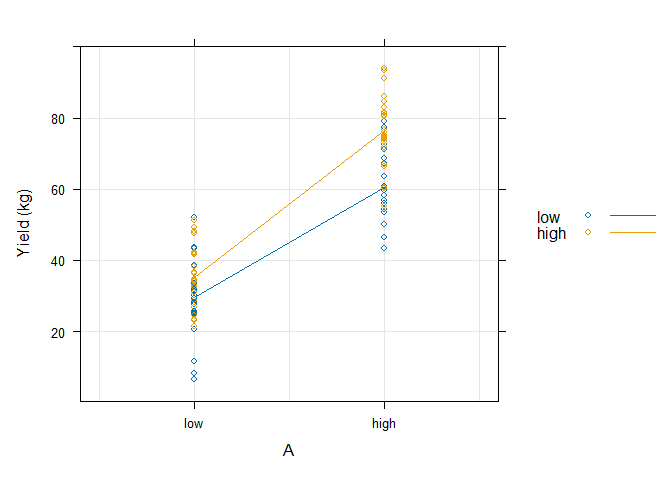
lattice::xyplot(I(means + rnorm(n, sd = 10)) ~ A, dat, groups = B,
type = c("g", "p", "a"), auto.key = TRUE, ylab = "Yield (kg)")
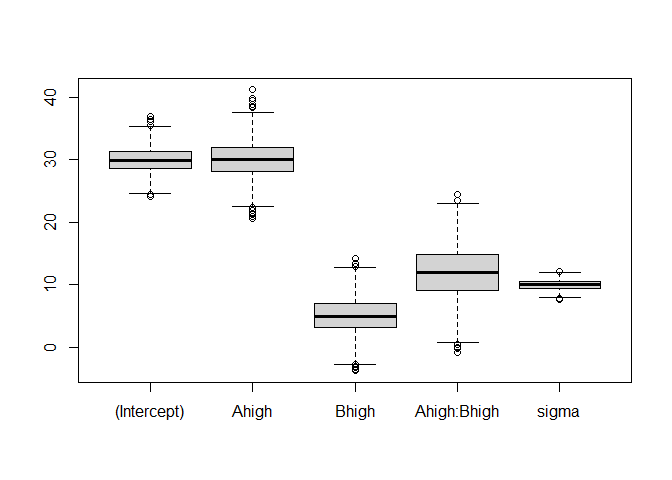
Parameter recovery
out <- replicate(2000, {
  y <- means + rnorm(n, sd = 10)   # y = mu + a + b + ab + e
  m <- aov(y ~ A * B, dat)
  c(coef(m), sigma = sigma(m))
})
boxplot(t(out))
Power simulation
pval <- replicate(2000, {
  y <- means + rnorm(n, sd = 10)
  m <- aov(y ~ A*B, dat)
  summary(m)[[1]]$"Pr(>F)"[3]      # test of interaction
})
mean(pval < 0.05)
## [1] 0.817