6.1 KiB
Exercise: Junior School Project
Load the Junior School Project collected from primary (U.S. term is
elementary) schools in inner London in R. You might need to install the
faraway package first with install.packages("faraway").
The data frame contains the following variables:
school |
50 schools code 1–50 |
class |
a factor with levels 1, 2, 3, and 4 |
gender |
a factor with levels boy and girl |
social |
class of the father I = 1; II = 2; III nonmanual = 3; III manual = 4; IV = 5; V = 6; Long-term unemployed = 7; Not currently employed = 8; Father absent = 9 |
raven |
test score |
id |
student id coded 1–1402 |
english |
score on English |
math |
score on Maths |
year |
year of school |
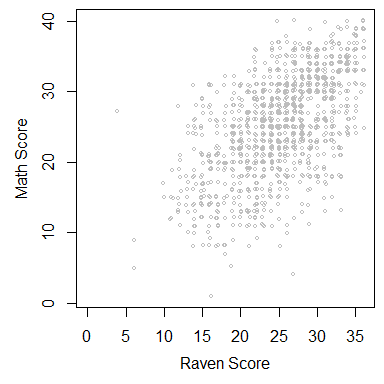
We want to investigate how math achievement is influenced by raven score and social class of the father. If you need a refresher on Raven’s Progressive Matrices, check here: https://en.wikipedia.org/wiki/Raven%27s_Progressive_Matrices. Basically, it is an intelligent test.
We will take a subset of the data, so that each student provides only one data point, for simplicity:
data("jsp", package = "faraway")
dat <- jsp |> subset(year == 0)
-
Create a new variable
cravenwhereravenis centered over all students -
Create another variable
gcravenwherecravenis centered over all schools. Create a variablemravencontaining the centered average school means first, so that you can calculate
dat$gcraven <- dat$craven - dat$mraven

# Check your results
aggregate(craven ~ school, dat, mean) |> head()
##   school     craven
## 1      1 -2.6886533
## 2      2  0.1250722
## 3      3  2.0584055
## 4      4  0.9167389
## 5      5  2.3512627
## 6      6  0.4584055
aggregate(gcraven ~ school, dat, mean) |> head()
##   school       gcraven
## 1      1  1.253746e-15
## 2      2 -1.184075e-15
## 3      3 -1.421172e-15
## 4      4  1.184283e-15
## 5      5  5.075722e-16
## 6      6  0.000000e+00
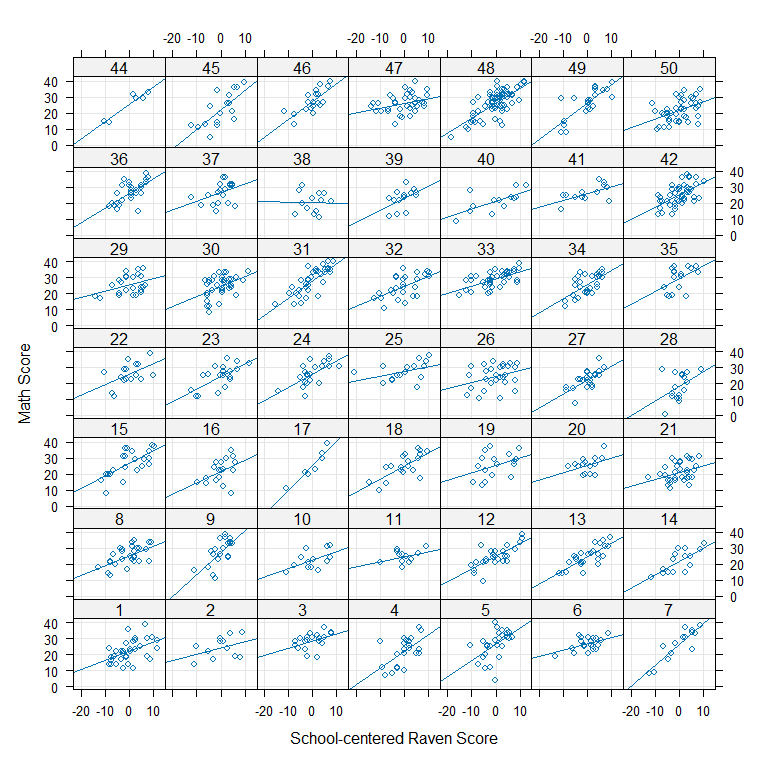
- Create a plot with
lattice::xyplot()withgcravenon the x-axis andmathon the y-axis and one panel for each school. Usetype = c("p", "g", "r"). You can also useggplot2if you want to. What would be your conclusion about the need for school-specific slopes based on this plot?
-
We will consider the following levels of the data:
- Level 1: students
- Level 2: schools
And the variables associated with the levels:
Level Variable Description 2 school50 schools code 1–50 2 mravenmean raven score of school (overall mean 0) 1 socialclass of the father (categorical) 1 gcravencentered test score (mean for each school 0) 1 mathscore on Maths Fit the following model containing school-specific intercepts and slopes with
lme4::lmer()\begin{align*} \text{(Level 1)} \quad y_{ij} &= b_{0i} + b_{1i}\,gcraven_{ij} + b_{2i}\,social_{ij} + b_{3i}\,(gcraven_{ij}\times social_{ij}) + \varepsilon_{ij}\\ \text{(Level 2)} \quad b_{0i} &= \beta_0 + \beta_4\,mraven_i + \upsilon_{0i} \\ \quad b_{1i} &= \beta_1 + \beta_5\,mraven_i + \upsilon_{1i}\\ \quad b_{2i} &= \beta_2\\ \quad b_{3i} &= \beta_3\\ \text{(2) in (1)} \quad y_{ij} &= \beta_{0} + \beta_{1}\,gcraven_{ij} + \beta_{2}\,social_{ij} + \beta_{3}(gcraven_{ij}\times social_{ij})\\ &~~~ + \beta_{4}\,mraven_i + \beta_{5}\,(gcraven_{ij} \times mraven_{i})\\ &~~~ + \upsilon_{0i} + \upsilon_{1i}\,gcraven_{ij} + \varepsilon_{ij} \end{align*}with
\boldsymbol\upsilon \sim N(\boldsymbol 0, \boldsymbol{\Sigma}_\upsilon)i.i.d.,\varepsilon_{ij} \sim N(0, \sigma^2)i.i.d. -
Interpret the parameters of the model:
- How much does math score increases if the raven score for a student increases by one point for the reference social class of the father?
- How much does math score increases when the raven score per school increases by one point for the reference social class of the father?
- What is your conclusion about the interactions in the model. Are they needed?
- Does the inclusion of
socialimprove the model fit? How can we test this?