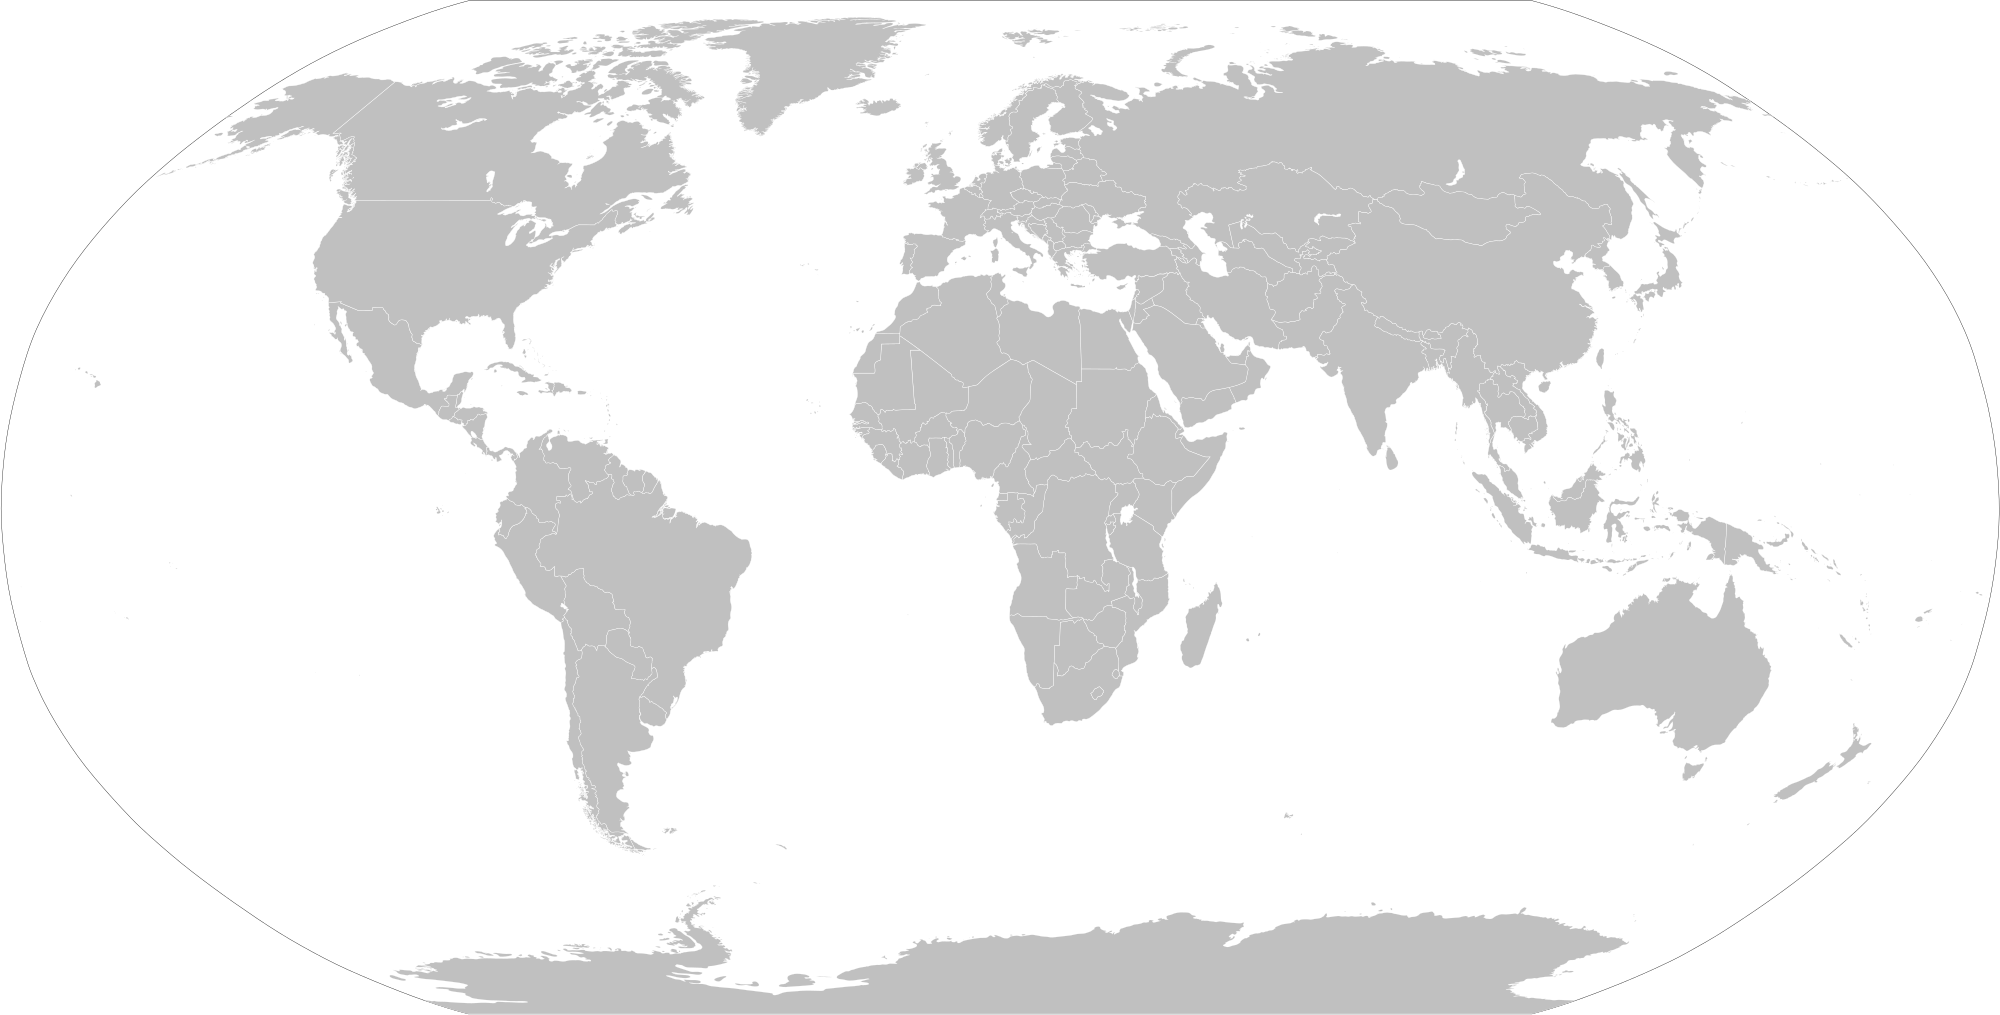
<!DOCTYPE html> <html lang="en"> <head> <meta charset="UTF-8" /> <title>Projections</title> <link rel="stylesheet" href="../../../3rdparty/highlight/styles/default.css" /> <link rel="stylesheet" href="../../../../css/doctest.css" /> <script src="../../../../dist/iwmlib.3rdparty.js"></script> <script src="../../../../dist/iwmlib.js"></script> <script src="../../../../dist/iwmlib.pixi.js"></script> <style> .inline-showcase { display: flex; } .map-example { display: inline-block; width: 256px; margin: 5px; } .map-wrapper { position: relative; /* inline-block create additional space around child elements. */ display: inline-flex; } .long { position: absolute; top: 0; bottom: 0; width: 1px; background-color: yellowgreen; } .point { top: 50%; left: 50%; transform: translate(-50%, -50%); position: absolute; width: 3px; height: 3px; background-color: red; border-radius: 50%; } .small.point { width: 1px; height: 1px; } .line { position: absolute; width: 100%; left: 0; border: 0.5px solid red; } </style> </head> <body onload="Doctest.run()"> <h1>Projections</h1> <p> Projections are used on the mapdata to translate coordinates to pixelpositions. There are various projections that can be used. All implemented ones are showcased here. </p> <section id="mercator"> <h2>Mercator Projection</h2> <p>The most commonly used projection is the mercator projection.</p> <div id="mercatorMap" class="map-wrapper"> <img src="../../../examples/osm/0/0/0.png" alt="" /> </div> <script> let boundaries = [ // { x: -90, y: -180 }, // { x: 90, y: 180 }, // { x: 0, y: 0 }, // { x: 90, y: -180 }, // Eastern Boundaries // { x: -22, y: 180 }, // { x: -43, y: 180 }, // { x: -63, y: 180 }, // { x: -73, y: 180 }, // { x: -83, y: 180 }, // { x: -87, y: 180 }, // { x: 0, y: 180 }, // { x: 22, y: 180 }, // { x: 43, y: 180 }, // { x: 63, y: 180 }, // { x: 73, y: 180 }, // { x: 83, y: 180 }, { x: 87, y: 180 }, // { x: -90, y: 180 }, // Western Boundaries { x: -22, y: -180 }, { x: -43, y: -180 }, { x: -63, y: -180 }, { x: -73, y: -180 }, { x: -83, y: -180 }, { x: -87, y: -180 }, { x: 0, y: -180 }, { x: 22, y: -180 }, { x: 43, y: -180 }, { x: 63, y: -180 }, { x: 73, y: -180 }, { x: 83, y: -180 }, { x: 87, y: -180 }, { x: -90, y: -180 } ] let capitals = { abidjan: { x: 5, y: -5 }, canberra: { x: -35.312146, y: 149.121539 }, berlin: { x: 52.52543, y: 13.385291 }, capetown: { x: -33.925448, y: 18.416962 }, moscow: { x: 55.750892, y: 37.622799 }, washington: { x: 38.89565, y: -77.031407 }, rio: { x: -22.8714, y: -43.28049 }, tokio: { x: 35.696278, y: 139.731366 } } /** * */ function createPointAtPoisition(position, className = '', style = {}) { console.log(position) let point = document.createElement('div') point.className = 'point ' + className Object.assign(point.style, { backgroundColor: "0xff0000" }, style, { left: position.x * 100 + '%', top: position.y * 100 + '%' }) return point } /** * Draws a vertical line at the zero longitude of a map. */ function drawZeroLongitude(projection, parent) { let element = document.createElement("div") element.className = "long" let position = projection.forward({ x: 0, y: 0 }) element.style.left = position.x * 100 + "%" parent.appendChild(element) } /** * Plots a point for a specific interval on the map. Distance defines that interval. */ function plotGridPoints(distance = 10, projection, parent) { for (let lat = -90; lat <= 90; lat += distance) { for (let lng = -180; lng <= 180; lng += distance) { let relativePosition = projection.forward({ x: lat, y: lng }) let point = createPointAtPoisition(relativePosition, 'small', { backgroundColor: '#0000ff' }) robinsonMap.appendChild(point) } } } </script> <script class="doctest"> ; (function () { let mercatorProjection = new Projection.Mercator() for (let position of Object.values(capitals)) { let relativePosition = mercatorProjection.forward(position) let point = createPointAtPoisition(relativePosition) mercatorMap.appendChild(point) } boundaries.forEach(coord => { let relativePosition = mercatorProjection.forward(coord) let point = createPointAtPoisition(relativePosition, 'small', { backgroundColor: '#0000ff' }) mercatorMap.appendChild(point) }) })() </script> </section> <section id="robinson"> <h2>Robinson Projection</h2> <p> The robinson projection is a more 'artistic' approach, as it follows a table instead of a strict formula. It has severe distortions at the poles, but that distortion declines rapidly heading towards the equator. </p> <div id="robinsonMap" class="map-wrapper"> <img src="../../assets/maps/wikimedia-world-robinson/2000px-BlankMap-World.png" alt="" width="512" /> </div> <script class="doctest"> ; (function () { // Create the robinson projection. let robinsonProjection = new Projection.Robinson(10) // Note: The center on this map is at approximately latitude 10, // therefore the projection must be shifted. /** * Create a point for each capital. */ for (let position of Object.values(capitals)) { let relativePosition = robinsonProjection.forward(position) let point = createPointAtPoisition(relativePosition) robinsonMap.appendChild(point) } drawZeroLongitude(robinsonProjection, robinsonMap) plotGridPoints(5, robinsonProjection, robinsonMap) })() </script> </section> </body> </html>